New: Damage Distribution Graph
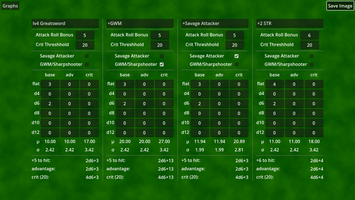
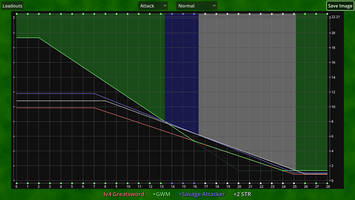
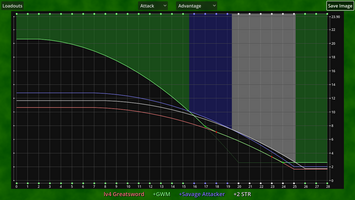
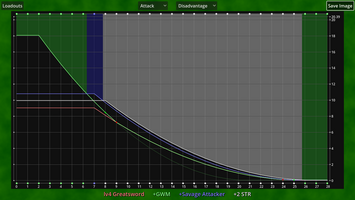
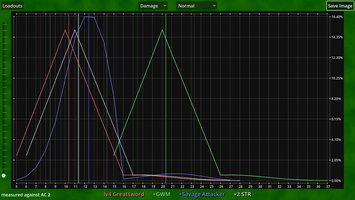
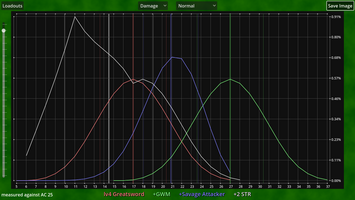
With this update, there’s another graph view that can be used to compare loadouts to one another.
To reach this view, select “Damage” in the option button at the top of the graph view. It shows the possible damage rolls (x-axis) and their respective probability (y-axis) for each loadout in the loadouts colour (see the colour of the loadouts name below the graph). Hit chances are included in the damage probabilities, and adjusting the slider on the right will adjust the target armor class that determines the hit and miss chances.
The thick vertical line of each graphs colour shows the average damage of their loadout, and the thinner lines are one standard deviation away from that average. This allows you to more easily compare the graphs to each other.
Hovering over one of the loadouts names will put that loadouts graph in the foreground and mute the other graphs, in case you wish to take a closer look.
For loadouts with Great Weapon Master / Sharpshooter enabled, the main graph will always show the damage distribution with the highest average (adjusted for hit chance) among the feat being toggled on or off. The other damage distribution will also be shown, though with a thinner line and a darker colour. I hope you’ll find this useful for your comparisons.
There’s also some smaller adjustments:
- saving an image will now open a file dialog that allows you to choose where to save the screenshot.
- the loadout now has another section at the bottom that displays the entered die amounts in a legible manner. For example, if you entered a 2 in the field for base d6, it will be shown as 2d6 down where the base dice are displayed, and as 4d6 for the line that displays the crit die amounts.
Have a nice day :)
Files
Get Baldur's Gate 3 Weapon Loadout Comparer
Baldur's Gate 3 Weapon Loadout Comparer
Compare different weapon loadouts for Baldur's Gate 3 and DnD
| Status | Released |
| Category | Tool |
| Author | Lunis Peace |
| Tags | Godot, No AI |
Leave a comment
Log in with itch.io to leave a comment.